Streamline Your Sales Analysis with Google Apps Script: A Comprehensive Guide
In the world of sales and business, time is money. Analyzing sales data can be a time-consuming task, often involving manual calculations and repetitive tasks. However, with the advancement of scripting and automation tools, there’s a better way to handle this – enter Google Apps Script.
Google Apps Script offers a powerful yet approachable solution for automating tasks in Google Sheets, and in this guide, we’ve tackled automating sales data analysis. This project aims to save you hours of work by calculating total sales, average sales per item, and identifying the best-selling item with just a few clicks.
Project Overview: The essence of this automation lies in creating a script that processes sales data within a Google Sheet. It calculates key metrics and generates a summary report in a separate sheet, providing quick and actionable insights.
Step-by-Step Tutorial:
- Setup Your Sheet: Begin with inputting your sales data into a new Google Sheet.
- Script Creation: Navigate to the Apps Script editor and input the script designed to analyze your data.
- Running the Script: With the script saved, run it to perform the analysis, and voila, a summary sheet is created with all your crucial sales metrics.
This automation not only enhances efficiency but also reduces the likelihood of errors associated with manual data entry and calculations.
Key Learnings:
- Automating repetitive tasks can significantly increase productivity.
- Google Apps Script is a versatile tool that can be leveraged for various automation tasks within Google Sheets.
- Understanding basic scripting can open up numerous possibilities for data analysis and reporting.
Conclusion: Automating sales data analysis with Google Apps Script is a practical and efficient way to handle your data needs. Whether you’re a small business owner, a sales analyst, or someone looking to streamline their workflow, this guide provides a foundation to get started with automation in Google Sheets.
Explore the full potential of Google Apps Script and take your productivity to the next level.
Tags: Google Apps Script, Sales Data Analysis, Automation, Google Sheets, Data Analysis, Productivity, Business Intelligence
Exercise: Sales Data Analysis Automation


Project Objective:
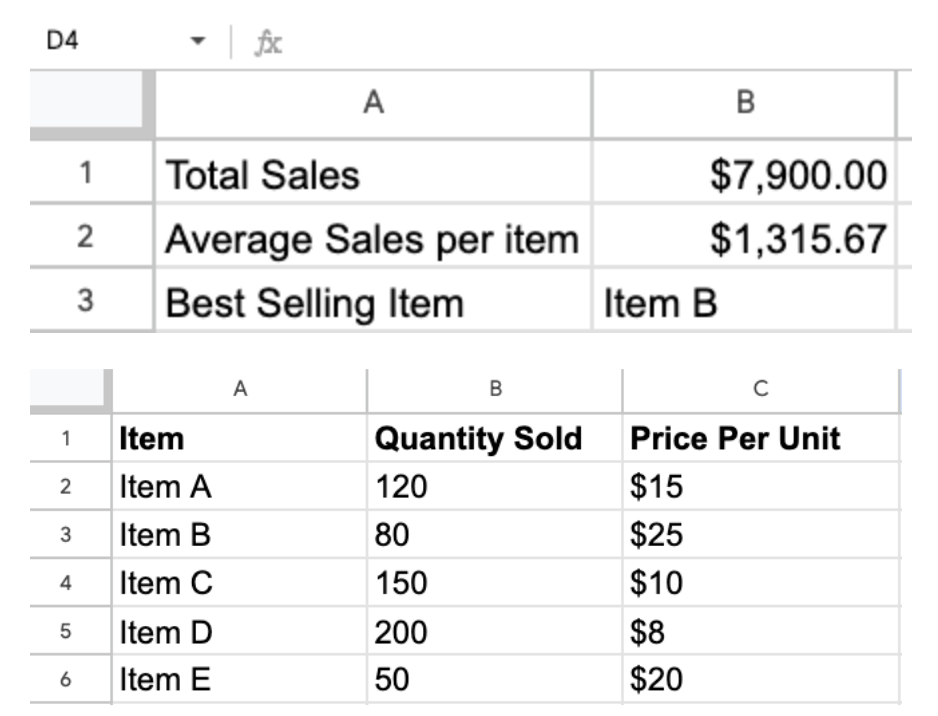
Create a Google Apps Script to analyze sales data in a Google Sheet. The script will calculate total sales, average sales per item, and identify the best-selling item. Additionally, the script will generate a summary report on a separate sheet.
Data Table:
Assume your Google Sheet has the following data in Sheet1:
| Item | Quantity Sold | Price Per Unit |
| Item A | 120 | $15 |
| Item B | 80 | $25 |
| Item C | 150 | $10 |
| Item D | 200 | $8 |
| Item E | 50 | $20 |
Steps to create project:
Setup Initial Sheet:
- Open a new Google Sheet and input the above data into Sheet1.
Create a Script:
- Open the Apps Script editor by clicking on Extensions > Apps Script.
- Delete any code in the script editor and replace it with the provided code below.
Script Code:
function analyzeSalesData(){

 const ss = SpreadsheetApp.getActiveSpreadsheet();

 const sheet = ss.getSheetByName('Sheet1');

 const dataRange = sheet.getDataRange();

 const data = dataRange.getValues();

 let totalSales = 0;

 let itemCount = 0;

 const salesData = [];

  // Skip header row by starting at index 1

 for(let i=1;i<data.length;i++){

   const quantity = data[i][1];

   const price = parseFloat(data[i][2].toString().replace('$',''));

   const sales = quantity * price;

   totalSales+=sales;

   itemCount+=quantity;

   salesData.push([data[i][0],sales]);

 }

 const aveSalesPerItem = totalSales/data.length-1;

 const bestSeller = salesData.reduce((max,item)=> item[1]>max[1] ? item :max)[0];

  // Create or get the summary sheet

 let summarySheet = ss.getSheetByName('Summary');

 if(!summarySheet){

   summarySheet = ss.insertSheet('Summary');

 }else{

   summarySheet.clear();

 }

  // Generate summary report

 summarySheet.appendRow(['Total Sales',`$${totalSales.toFixed(2)}`]);

 summarySheet.appendRow(['Average Sales per item',`$${aveSalesPerItem.toFixed(2)}`]);

 summarySheet.appendRow(['Best Selling Item',bestSeller]);

}
Run the Script:
- Save the script and run analyzeSalesData function.
- Authorize the script if prompted.
Check the Output:
- A new sheet named “Summary” should be created with the calculated total sales, average sales per item, and the best-selling item.
Multiple Choice Questions:
What does getValues() return in the script?
A) A single value of the selected cell.
B) An array of arrays containing the data in the range.
C) A string representation of the data.
D) An object containing the range’s properties.
Answer: B) An array of arrays containing the data in the range.
Explanation: The getValues() method returns a two-dimensional array of values, representing the data for the range specified.
What is the purpose of parseFloat(data[i][2].replace(‘$’, ”))?
A) To convert the string value to an integer.
B) To remove the dollar sign from the data.
C) To convert the string value to a floating-point number.
D) Both B and C.
Answer: D) Both B and C.
Explanation: This code removes the dollar sign from the price and converts the resulting string into a floating-point number for mathematical operations.
How is the best-selling item determined in the script?
A) By finding the item with the highest quantity sold.
B) By calculating the highest total sales per item.
C) By identifying the item with the highest price per unit.
D) By the quantity of items available in stock.
Answer: B) By calculating the highest total sales per item.
Explanation: The script calculates total sales for each item and identifies the item with the highest total sales as the best-selling item.
What does the reduce method do in the context of finding the best-selling item?
A) It filters out items with sales less than a certain threshold.
B) It sums up the total sales of all items.
C) It iterates through the salesData array to find the item with the highest sales.
D) It sorts the items by their sales in ascending order.
Answer: C) It iterates through the salesData array to find the item with the highest sales.
Explanation: The reduce method is used to iterate through the salesData array, comparing each item’s sales to find and return the item with the highest sales.
What happens if the “Summary” sheet already exists when the script runs?
A) The script will throw an error.
B) It will delete the existing “Summary” sheet and create a new one.
C) It will clear the existing “Summary” sheet and update it with new data.
D) The script will ignore the existing “Summary” sheet and create a duplicate.
Answer: C) It will clear the existing “Summary” sheet and update it with new data.
Explanation: If the “Summary” sheet already exists, the script clears it and updates it with the new summary data, avoiding duplication or error.