
Learn the formulas, techniques, data analysis methods, and automation skills that turn everyday spreadsheets into powerful productivity tools.
Free Interactive Learning Studio:
https://discoveryvip.com/google-sheets-studio/
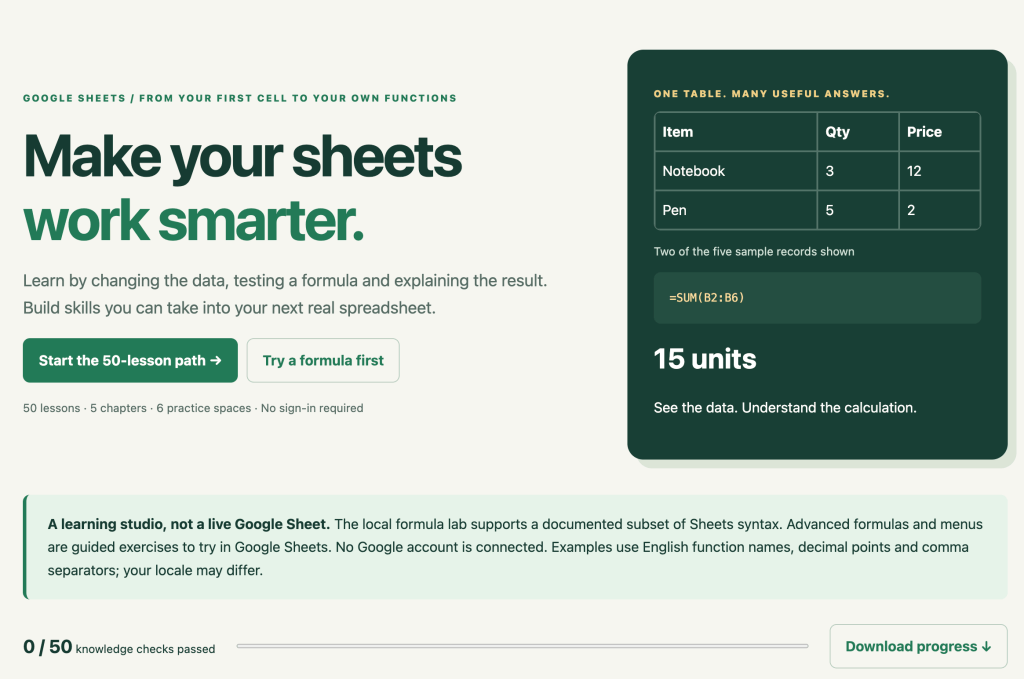
Most people use Google Sheets as a place to store information. They enter numbers, organize lists, and occasionally use a SUM formula.
But Google Sheets can do much more.
It can help you analyze information, automate calculations, identify trends, build dashboards, track projects, and even create custom functions using JavaScript.
The difference between a basic spreadsheet user and an advanced one isn’t necessarily knowing hundreds of formulas.
It’s understanding how to turn raw data into useful answers.
In this guide, we’ll explore practical techniques you can start using immediately. You’ll also discover a free, interactive Google Sheets Learning Studio featuring 50 lessons, hands-on exercises, formula challenges, and opportunities to experiment with JavaScript.
Let’s begin with something simple.
1. Think of Your Spreadsheet as a Data System
Imagine you’re tracking orders for a small business.
Your spreadsheet contains the following information:
| Item | Quantity | Price | Team |
|---|---|---|---|
| Notebook | 3 | 12 | Sales |
| Pen | 5 | 2 | Sales |
| Folder | 4 | 6 | Marketing |
| Planner | 2 | 18 | Sales |
| Marker | 1 | 8 | Marketing |
At first glance, this is just a table.
But a well-structured table can answer questions like:
- How many products were ordered?
- What is the total value of all orders?
- Which team generated the most revenue?
- Which products contribute the most value?
- What happens if quantities or prices change?
The first important lesson: organize your data so that each row represents one record and each column represents one type of information.
Avoid mixing titles, totals, and notes into the middle of your data.
A clean table makes formulas, filters, charts, and future automation much easier.
2. Five Essential Google Sheets Formulas Everyone Should Know
You don’t need dozens of complicated formulas to become productive.
Start with five powerful functions.
SUM — Add values together
=SUM(B2:B6)This calculates the total quantity across the five records.
In our example, the result is 15 units.
Instead of manually adding numbers, SUM automatically updates whenever the underlying data changes.
AVERAGE — Understand typical values
=AVERAGE(C2:C6)This calculates the average price across the five products.
The result is 9.20.
AVERAGE is useful for analyzing test scores, expenses, sales figures, and performance measurements.
COUNTIF — Count records that match a condition
=COUNTIF(D2:D6,"Sales")This counts how many records belong to the Sales team.
The result is 3.
You can also count quantities that exceed a threshold:
=COUNTIF(B2:B6,">=3")The result is 3 because three products have quantities of at least three.
IF — Make decisions automatically
=IF(B2>=3,"Bulk Order","Regular Order")This formula checks whether a quantity is at least three.
If true, it displays “Bulk Order.”
Otherwise, it displays “Regular Order.”
IF statements are useful for categorization, reporting, and applying business rules.
SUMIF — Add values based on a condition
Suppose column E contains each order’s value, calculated using:
=B2*C2Copy this formula down to E6.
Now calculate the total order value for the Sales team:
=SUMIF(D2:D6,"Sales",E2:E6)The result is 82.
This introduces an important concept: conditional aggregation, which means calculating totals only for records that meet particular criteria.
Once you understand this, you can build much more sophisticated reports.
3. The Secret to Better Formulas: Understand Cell References
One of the most common spreadsheet frustrations happens when copying formulas.
You create a formula that works perfectly, drag it into another cell, and suddenly the results are wrong.
The problem is often the type of cell reference.
There are three important patterns.
Relative reference
=A2*B2When copied down one row, it becomes:
=A3*B3Both references move.
Absolute reference
=A2*$F$1Here, $F$1 stays fixed when the formula is copied.
This is useful when applying a single tax rate, commission percentage, or conversion factor across many records.
Mixed reference
=$B2The column B stays fixed, but the row can change.
This is particularly useful for reusable calculations and conditional formatting.
Practical exercise: Create a column of product prices and put a tax rate in F1. Write a formula that calculates the price with tax, then copy it down without changing the tax reference.
Understanding the dollar sign can save hours of troubleshooting.
4. Turn Spreadsheet Data Into Decisions
Calculations become much more useful when they answer real questions.
Let’s return to our sample order table.
The total value of all five orders is:
=SUMPRODUCT(B2:B6,C2:C6)The result is 140.
SUMPRODUCT multiplies each quantity by its corresponding price, then adds the results.
Now imagine you want to know which team contributed the most revenue.
Using the calculated values in column E:
| Team | Revenue |
|---|---|
| Sales | 82 |
| Marketing | 58 |
You can calculate these figures using SUMIF.
But you can also create a pivot table.
What is a pivot table?
A pivot table summarizes large amounts of data without requiring you to manually write formulas for every category.
In Google Sheets:
- Select your dataset, including the headers.
- Choose Insert → Pivot table.
- Add Team as a row category.
- Add Order Value as a value summarized by SUM.
You now have a report showing revenue by team.
Add a chart, and the numbers become a visual comparison.
This is how a basic spreadsheet begins to function as a reporting system.
5. Go Beyond Basic Formulas With FILTER and QUERY
As your spreadsheets grow, manually finding information becomes inefficient.
Two useful Google Sheets functions are FILTER and QUERY.
FILTER — Display only matching records
Suppose you want to show orders where quantity is greater than two.
=FILTER(A2:D6,B2:B6>2)This returns only the matching rows.
You could also filter records belonging to a particular team:
=FILTER(A2:D6,D2:D6="Sales")FILTER is useful for building dynamic lists and focused reports.
QUERY — Ask questions about your data
QUERY allows you to select, filter, group, and summarize data using a query language.
For example:
=QUERY(A1:D6,"select D, count(A) where D is not null group by D label count(A) 'Orders'",1)This creates a summary showing the number of orders for each team.
QUERY is especially valuable when your dataset contains hundreds or thousands of records.
Important: QUERY and some advanced formulas are best practiced directly in Google Sheets. The Learning Studio provides guidance for these concepts, but its local formula interpreter intentionally supports a smaller subset of spreadsheet syntax.
6. Build Dashboards That Tell a Story
A dashboard should do more than display attractive charts.
It should help someone understand what’s happening and decide what to do next.
Imagine a project dashboard that includes:
- Total orders processed
- Total revenue
- Revenue by team
- Average order value
- A chart comparing categories
These metrics are often called key performance indicators, or KPIs.
The most useful dashboards connect the underlying data to the summary.
When the source data changes, the dashboard should reflect those changes.
A good dashboard also avoids unnecessary complexity.
Instead of displaying twenty charts, focus on three or four questions your audience actually needs answered.
Practical challenge: Create a spreadsheet containing 20 sample orders. Calculate the total revenue, identify the highest-value order, and build a chart comparing revenue by team.
Ask yourself: What decision could someone make after viewing this report?
That’s the real purpose of data visualization.
7. Create Your Own Reusable Functions
One of the most exciting features of Google Sheets is the ability to extend its capabilities.
There are two approaches worth learning.
Named functions
Named functions let you turn a formula into something reusable without writing JavaScript.
Imagine frequently calculating a price after a discount.
The underlying formula might be:
=price*(1-discount)You could create a named function called:
=DISCOUNTED_PRICE(100,0.15)The result would be 85.
Instead of remembering the entire formula, you use a meaningful function name.
In Google Sheets, named functions can be created through Data → Named functions.
This is particularly useful for organizations that want consistent calculations across their spreadsheets.
Custom functions with Google Apps Script
For more advanced requirements, you can create custom functions using JavaScript.
For example:
function DOUBLE_VALUES(value) {
  if (Array.isArray(value)) {
    return value.map(row =>
      row.map(cell =>
        typeof cell === "number" ? cell * 2 : cell
      )
    );
  }

  return typeof value === "number"
    ? value * 2
    : value;
}
This function doubles numeric values while preserving other types.
After adding it to a spreadsheet’s Apps Script project, you can use:
=DOUBLE_VALUES(B2:B6)The function processes a range and returns the results.
This is a simple example of how spreadsheet formulas and programming can work together.
Once you understand the connection, you can begin exploring more advanced spreadsheet solutions.
8. Learn by Experimenting, Not Just Watching Tutorials
Reading about formulas is useful.
Watching someone else use a spreadsheet can also help.
But real understanding develops when you change something, predict the result, test your idea, and explain what happened.
For example, take this formula:
=IF(B2>=3,"High","Low")Before calculating the result, ask yourself:
What happens if B2 contains 2?
What happens if it contains 3?
What happens if it contains 10?
Now change the input and observe the output.
This is a simple but powerful learning process:
Predict → Experiment → Observe → Explain → Apply
Instead of memorizing a formula, you’re learning how the formula behaves.
And that knowledge transfers to other spreadsheets.
This approach connects directly to the principles behind my Vibe Learning Framework: curiosity, exploration, understanding, practice, feedback, and applying what you’ve learned.
Introducing the Free Google Sheets Learning Studio
https://discoveryvip.com/google-sheets-studio
To make these skills easier to learn, I’ve created a free interactive learning environment on DiscoveryVIP.
The Google Sheets Learning Studio is designed to help you progress from basic spreadsheet concepts to formulas, data analysis, reusable functions, and JavaScript-powered customization.
It includes 50 lessons organized into five chapters and six interactive practice spaces.
What can you explore?
1. Structured learning path
Work through 50 lessons, complete knowledge checks, and track your understanding as you progress.
You can also download a lesson handbook and export your progress.
2. Interactive formula workshop
Edit sample order records, enter supported formulas, and immediately observe how your calculations respond to different values.
Practice with functions, operators, references, and logical expressions.
3. Cell reference explorer
Experiment with relative, absolute, and mixed references.
See how a reference changes when copied across rows or columns.
4. Named-function builder
Explore reusable formula recipes and generate setup instructions that you can take into Google Sheets.
5. JavaScript custom-function lab
Experiment with a custom function, run automated checks, and download an Apps Script .gs file.
6. Interactive order dashboard
Explore how changing quantities and prices affects calculated revenue and team-level reporting.
You can also download a capstone checklist to guide your own project.
Important distinction
The studio is an independent educational learning environment, not a live Google spreadsheet.
Its formula workshop uses a small, documented interpreter, while more advanced features are taught through guided exercises to try in Google Sheets itself.
No Google account needs to be connected to use the studio.
This makes it a useful environment for learning concepts before applying them to real spreadsheet projects.
9. Your Practical Google Sheets Learning Challenge
Here’s a project you can complete to bring everything together.
Build a simple sales performance dashboard.
Start with a spreadsheet containing the following columns:
- Product
- Quantity
- Price
- Team
- Order Value
Then work through these steps:
Step 1: Calculate Order Value using multiplication.
Step 2: Use SUM to calculate total revenue.
Step 3: Use AVERAGE to calculate the average order value.
Step 4: Use COUNTIF to count records belonging to a particular team.
Step 5: Use SUMIF to calculate revenue by team.
Step 6: Create a chart comparing team performance.
Step 7: Add a dropdown or filter to explore a specific category.
Step 8: Experiment with a named function that simplifies one of your recurring calculations.
Step 9: Explore how a JavaScript custom function could extend your spreadsheet.
Step 10: Explain what your dashboard reveals and what someone could do with the information.
By the end, you won’t just have practiced formulas.
You’ll have built a small, functional reporting solution.
10. The Bigger Opportunity: Spreadsheets as a Gateway to Automation
Google Sheets is often one of the easiest places to begin learning practical automation.
Why?
Because spreadsheets already contain the essential building blocks of many software applications:
Data: Rows, columns, and structured records.
Logic: Formulas, comparisons, and conditional calculations.
Transformation: Cleaning, combining, and processing information.
Presentation: Reports, charts, and dashboards.
Automation: Reusable functions, scripts, and connected workflows.
Once you understand these building blocks, you can apply similar thinking to other tools, databases, web applications, and AI-assisted workflows.
You don’t need to become a professional programmer to benefit from these skills.
But learning how data and logic work together can dramatically improve the way you solve problems.
Start Learning Google Sheets Today
Whether you’re a student, educator, entrepreneur, analyst, office professional, or someone who simply wants to become more productive, Google Sheets is a skill worth developing.
Start with one formula.
Understand what it does.
Change the inputs.
Explore the result.
Then use that knowledge to solve a real problem.
Explore the free 50-lesson Google Sheets Learning Studio:
https://discoveryvip.com/google-sheets-studio
No sign-in required to explore the interactive learning environment.
Created by Laurence Lars Svekis, developer, educator, Google Developer Expert for Google Workspace, and instructor to over 3 million students.
My goal is to make practical technology education more accessible, interactive, and immediately useful.
Let’s Discuss
What’s the one Google Sheets skill you wish you had learned earlier?
Is it advanced formulas, pivot tables, dashboards, automation, or custom functions?
Share your thoughts in the comments. Your answer might inspire someone else’s next learning project.
#GoogleSheets #GoogleWorkspace #SpreadsheetTips #DataAnalysis #LearnGoogleSheets #GoogleAppsScript #JavaScript #Automation #Productivity #DataVisualization #SpreadsheetAutomation #DigitalSkills #OnlineLearning #VibeLearning #LearnByDoing #GoogleDeveloperExpert #DiscoveryVIP